Autoscaling AWS Elastic Beanstalk worker tier based on SQS queue length
We are deploying a Rails application (for the Hydra-in-a-Box project) to AWS Elastic Beanstalk. Elastic Beanstalk offers us easy deployment, monitoring, and simple auto-scaling with a built-in dashboard and management interface. Our application uses several potentially long-running background jobs to characterize, checksum, and create derivates for uploaded content. Since we’re deploying this application within AWS, we’re also taking advantage of the Simple Queue Service (SQS), using the active-elastic-job gem to queue and run ActiveJob tasks.
Elastic Beanstalk provides settings for “Web server” and “Worker” tiers. Web servers are provisioned behind a load balancer and handle end-user requests, while Workers automatically handle background tasks (via SQS + active-elastic-job). Elastic Beanstalk provides basic autoscaling based on a variety of metrics collected from the underlying instances (CPU, Network, I/O, etc), although, while sufficient for our “Web server” tier, we’d like to scale our “Worker” tier based on the number of tasks waiting to be run.
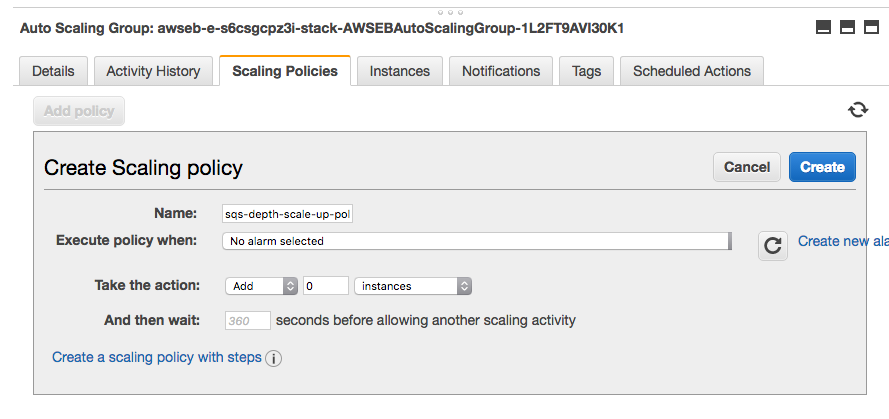
Currently, though, the ability to auto-scale the worker tier based on the underlying queue depth isn’t enable through the Elastic Beanstak interface. However, as Beanstalk merely manages and aggregates other AWS resources, we have access to the underlying resources, including the autoscaling group for our environment. We should be able to attach a custom auto-scaling policy to that auto scaling group to scale based on additional alarms.
For example, let’s we want to add additional worker nodes if there are more than 10 tasks for more than 5 minutes (and, to save money and resources, also remove worker nodes when there are no tasks available). To create the new policy, we’ll need to:
- find the appropriate auto-scaling group by finding the Auto-scaling group with the
elasticbeanstalk:environment-idthat matches the worker tier environment id; - find the appropriate SQS queue for the worker tier;
- add auto-scaling policies that add (and remove) instances to the autoscaling group;
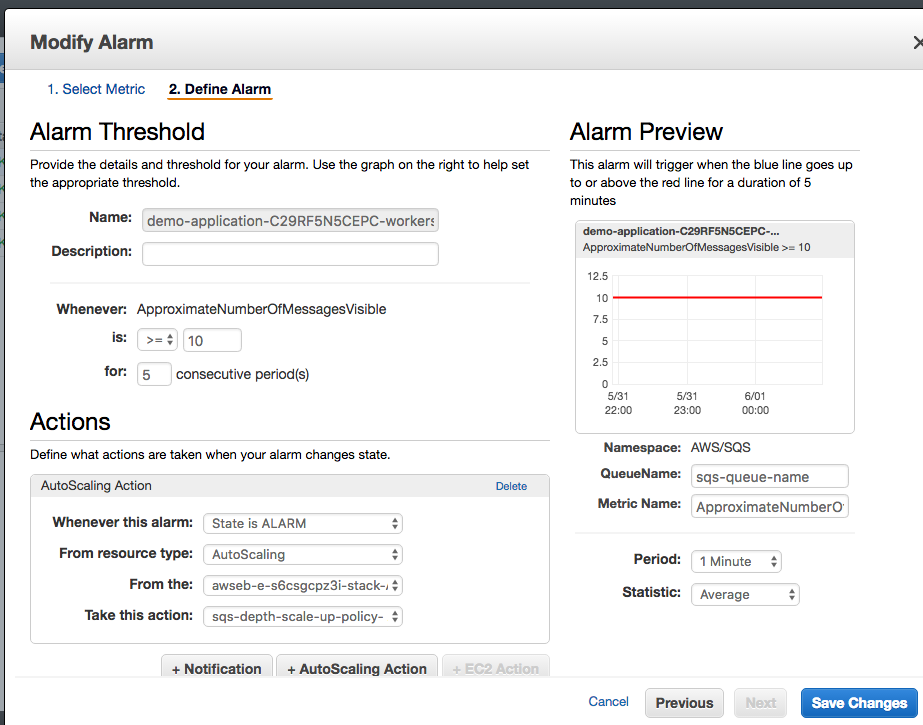
- create a new CloudWatch alarm that measures the SQS queue exceeds our configured depth (5) that triggers the auto-scaling policy to add additional worker instances whenever the alarm is triggered;
- and, conversely, create a new CloudWatch alarm that measures the SQS queue hits 09 that trigger the auto-scaling action to removes worker instances whenever the alarm is triggered.
and, similarly for scaling back down. Even though there are several manual steps, they aren’t too difficult (other than discovering the various resources we’re trying to orchestrate), and using Elastic Beanstalk is still valuable for the rest of its functionality. But, we’re in the cloud, and really want to automate everything. With a little CloudFormation trickery, we can even automate creating the worker tier with the appropriate autoscaling policies.
First, knowing that the CloudFormation API allows us to pass in an existing SQS queue for the worker tier, let’s create an explicit SQS queue resource for the workers:
"DefaultQueue" : {
  "Type" : "AWS::SQS::Queue",
}
And wire it up to the Beanstalk application by setting the aws:elasticbeanstalk:sqsd:WorkerQueueURL (not shown: sending the worker queue to the web server tier):
"WorkersConfigurationTemplate" : {
  "Type" : "AWS::ElasticBeanstalk::ConfigurationTemplate",
  "Properties" : {
    "ApplicationName" : { "Ref" : "AWS::StackName" },
    "OptionSettings" : [
      ...,
      {
        "Namespace": "aws:elasticbeanstalk:sqsd",
        "OptionName": "WorkerQueueURL",
        "Value": { "Ref" : "DefaultQueue"}
      }
    }
  }
},
"WorkerEnvironment": {
  "Type": "AWS::ElasticBeanstalk::Environment",
  "Properties": {
    "ApplicationName": { "Ref" : "AWS::StackName" },
    "Description": "Worker Environment",
    "EnvironmentName": { "Fn::Join": ["-", [{ "Ref" : "AWS::StackName"}, "workers"]] },
    "TemplateName": { "Ref": "WorkersConfigurationTemplate" },
    "Tier": {
      "Name": "Worker",
      "Type": "SQS/HTTP"
    },
    "SolutionStackName" : "64bit Amazon Linux 2016.03 v2.1.2 running Ruby 2.3 (Puma)"
    ...
  }
}
Using our queue we can describe one of the CloudWatch::Alarm resources and start describing a scaling policy:
"ScaleOutAlarm" : {
  "Type": "AWS::CloudWatch::Alarm",
  "Properties": {
    "MetricName": "ApproximateNumberOfMessagesVisible",
    "Namespace": "AWS/SQS",
    "Statistic": "Average",
    "Period": "60",
    "Threshold": "10",
    "ComparisonOperator": "GreaterThanOrEqualToThreshold",
    "Dimensions": [
      {
        "Name": "QueueName",
        "Value": { "Fn::GetAtt" : ["DefaultQueue", "QueueName"] }
      }
    ],
    "EvaluationPeriods": "5",
    "AlarmActions": [{ "Ref" : "ScaleOutPolicy" }]
  }
},
"ScaleOutPolicy" : {
  "Type": "AWS::AutoScaling::ScalingPolicy",
  "Properties": {
    "AdjustmentType": "ChangeInCapacity",
    "AutoScalingGroupName": ????,
    "ScalingAdjustment": "1",
    "Cooldown": "60"
  }
},
However, to connect the policy to the auto-scaling group, we need to know the name for the autoscaling group. Unfortunately, the autoscaling group is abstracted behind the Beanstalk environment.
To gain access to it, we’ll need to create a custom resource backed by a Lambda function to extract the information from the AWS APIs:
"BeanstalkStack": {
  "Type": "Custom::BeanstalkStack",
  "Properties": {
    "ServiceToken": { "Fn::GetAtt" : ["BeanstalkStackOutputs", "Arn"] },
    "EnvironmentName": { "Ref": "WorkerEnvironment" }
  }
},
"BeanstalkStackOutputs": {
  "Type": "AWS::Lambda::Function",
  "Properties": {
    "Code": {
      "ZipFile":  { "Fn::Join": ["\n", [
        "var response = require('cfn-response');",
        "exports.handler = function(event, context) {",
        "    console.log('REQUEST RECEIVED:\\n', JSON.stringify(event));",
        "    if (event.RequestType == 'Delete') {",
        "        response.send(event, context, response.SUCCESS);",
        "        return;",
        "    }",
        "    var environmentName = event.ResourceProperties.EnvironmentName;",
        "    var responseData = {};",
        "    if (environmentName) {",
        "      var aws = require('aws-sdk');",
        "      var eb  = new aws.ElasticBeanstalk();",
        "      eb.describeEnvironmentResources({EnvironmentName: environmentName}, function(err, data) {",
        "        if (err) {",
        "           responseData = { Error: 'describeEnvironmentResources call failed' };",
        "           console.log(responseData.Error + ':\\n', err);",
        "           response.send(event, context, resource.FAILED, responseData);",
        "        } else {",
        "           responseData = { AutoScalingGroupName: data.EnvironmentResources.AutoScalingGroups[0].Name };",
        "           response.send(event, context, response.SUCCESS, responseData);",
        "        }",
        "      });",
        "   } else {",
        "     responseData = {Error: 'Environment name not specified'};",
        "     console.log(responseData.Error);",
        "     response.send(event, context, response.FAILED, responseData);",
        "   }",
        "};"
      ]]}
    },
    "Handler": "index.handler",
    "Runtime": "nodejs",
    "Timeout": "10",
    "Role": { "Fn::GetAtt" : ["LambdaExecutionRole", "Arn"] }
  }
}
With the custom resource, we can finally get access the autoscaling group name and complete the scaling policy:
"ScaleOutPolicy" : {
  "Type": "AWS::AutoScaling::ScalingPolicy",
  "Properties": {
    "AdjustmentType": "ChangeInCapacity",
    "AutoScalingGroupName": { "Fn::GetAtt": [ "BeanstalkStack", "AutoScalingGroupName" ] },
    "ScalingAdjustment": "1",
    "Cooldown": "60"
  }
},
The complete worker tier is part of our CloudFormation stack: https://github.com/hybox/aws/blob/master/templates/worker.json
LDPath in 3 examples
At Code4Lib 2015, I gave a quick lightning talk on LDPath, a declarative domain-specific language for flatting linked data resources to a hash (e.g. for indexing to Solr).
LDPath can traverse the Linked Data Cloud as easily as working with local resources and can cache remote resources for future access. The LDPath language is also (generally) implementation independent (java, ruby) and relatively easy to implement. The language also lends itself to integration within development environments (e.g. ldpath-angular-demo-app, with context-aware autocompletion and real-time responses). For me, working with the LDPath language and implementation was the first time that linked data moved from being a good idea to being a practical solution to some problems.
Here is a selection from the VIAF record [1]:
<>
   void:inDataset <../data> ;
   a genont:InformationResource, foaf:Document ;
   foaf:primaryTopic <../65687612> .

<../65687612>
   schema:alternateName "Bittman, Mark" ;
   schema:birthDate "1950-02-17" ;
   schema:familyName "Bittman" ;
   schema:givenName "Mark" ;
   schema:name "Bittman, Mark" ;
   schema:sameAs <http://d-nb.info/gnd/1058912836>, <http://dbpedia.org/resource/Mark_Bittman> ;
   a schema:Person ;
   rdfs:seeAlso <../182434519>, <../310263569>, <../314261350>, <../314497377>, <../314513297>, <../314718264> ;
   foaf:isPrimaryTopicOf <http://en.wikipedia.org/wiki/Mark_Bittman> .
We can use LDPath to extract the person’s name:
So far, this is not so different from traditional approaches. But, if we look deeper in the response, we can see other resources, including books by the author.
<../310263569>
    schema:creator <../65687612> ;
    schema:name "How to Cook Everything : Simple Recipes for Great Food" ;
    a schema:CreativeWork .
We can traverse the links to include the titles in our record:
LDPath also gives us the ability to write this query using a reverse property selector, e.g:
books = foaf:primaryTopic / ^schema:creator[rdf:type is schema:CreativeWork] / schema:name :: xsd:string ;
The resource links out to some external resources, including a link to dbpedia. Here is a selection from record in dbpedia:
<http://dbpedia.org/resource/Mark_Bittman>
    dbpedia-owl:abstract "Mark Bittman (born c. 1950) is an American food journalist, author, and columnist for The New York Times."@en, "Mark Bittman est un auteur et chroniqueur culinaire américain. Il a tenu une chronique hebdomadaire pour le The New York Times, appelée The Minimalist (« le minimaliste »), parue entre le 17 septembre 1997 et le 26 janvier 2011. Bittman continue d'écrire pour le New York Times Magazine, et participe à la section Opinion du journal. Il tient également un blog."@fr ;
    dbpedia-owl:birthDate "1950+02:00"^^<http://www.w3.org/2001/XMLSchema#gYear> ;
    dbpprop:name "Bittman, Mark"@en ;
    dbpprop:shortDescription "American journalist, food writer"@en ;
    dc:description "American journalist, food writer", "American journalist, food writer"@en ;
    dcterms:subject <http://dbpedia.org/resource/Category:1950s_births>, <http://dbpedia.org/resource/Category:American_food_writers>, <http://dbpedia.org/resource/Category:American_journalists>, <http://dbpedia.org/resource/Category:American_television_chefs>, <http://dbpedia.org/resource/Category:Clark_University_alumni>, <http://dbpedia.org/resource/Category:Living_people>, <http://dbpedia.org/resource/Category:The_New_York_Times_writers> ;
LDPath allows us to transparently traverse that link, allowing us to extract the subjects for VIAF record:
[1] If you’re playing along at home, note that, as of this writing, VIAF.org fails to correctly implement content negotiation and returns HTML if it appears anywhere in the Accept header, e.g.:
curl -H "Accept: application/rdf+xml, text/html; q=0.1" -v http://viaf.org/viaf/152427175/
will return a text/html response. This may cause trouble for your linked data clients.
Building a Pivotal Tracker IRC bot with Sinatra and Cinch
We're using Pivotal Tracker on the Fedora Futures project. We also have an IRC channel where the tech team hangs out most of the day, and let each other know what we're working on, which tickets we're taking, and give each other feedback on those tickets. In order to document this, we try to put most of our the discussion in the tickets for future reference (although we are logging the IRC channel, it's not nearly as easy to look up decisions there). Because we're (lazy) developers, we wanted updates in Pivotal to get surfaced in the IRC channel. There was a (neglected) IRC bot, Pivotal-Tracker-IRC-bot, but it was designed to push and pull data from Pivotal based on commands in IRC (and, seems fairly abandoned). So, naturally, we built our own integration: Pivotal-IRC. This was my first time using Cinch to build a bot, and it was a surprisingly pleasant and straightforward experience:bot = Cinch::Bot.new do
configure do |c|
c.nick = $nick
c.server = $irc_server
c.channels = [$channel]
end
end
# launch the bot in a separate thread, because we're using this one for the webapp.
Thread.new {
bot.start
} post '/' do
message = Pivotal::WebhookMessage.new request.body.read
bot.channel_list.first.msg("#{message.description} #{message.story_url}")
endbot.on :message, /story\/show\/([0-9]+)/ do |m, ticket_id|
story = project.stories.find(ticket_id)
m.reply "#{story.story_type}: #{story.name} (#{story.current_state}) / owner: #{story.owned_by}"
endReal-time statistics with Graphite, Statsd, and GDash
We have a Graphite-based stack of real-time visualization tools, including the data aggregator Statsd. These tools let us easily record real-time data from arbitrary services with mimimal fuss. We present some curated graphs through GDash, a simple Sinatra front-end. For example, we record the time it takes for Solr to respond to queries from our SearchWorks catalog, using this simple bash script:tail -f /var/log/tomcat6/catalina.out | ruby solr_stats.rb(We rotate these logs through truncation; you can also use `tail -f --retry` for logs that are moved away when rotated)
And the ruby script that does the actual parsing:require 'statsd.rb'
STATSD = Statsd.new(...,8125)
# Listen to stdin
while str = gets
if str =~ /QTime=([^ ]+)/
# extract the QTime
ms = $1.to_i
# record it, based on our hostname
STATSD.timing("#{ENV['HOSTNAME'].gsub('.', '-')}.solr.qtime", ms)
end
end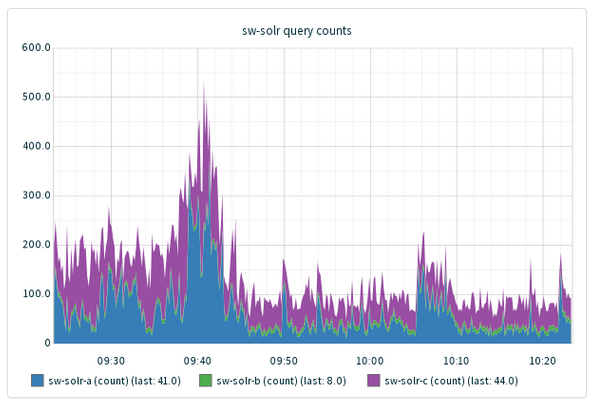
(hint: not quite; for a variety of reasons, we've sacrificed some marginal performance benefit for this
non-invasive, simpler load-blaance configuration.
(Answers to these questions and more in a future post, I'm sure.)
We also use this setup to monitor other services, e.g.:
- Is our Solr query time getting worse? (Ganglia can perform some basic manipulation, including taking integrals and derivatives)
- What is the rate of growth of our indexing backlog, and, can we process it in a reasonable timeframe, or should we scale the indexer service?
- Given our rate of disk usage, are we on track to run out of disk space this month? this week?
Icemelt: A stand-in for integration tests against AWS Glacier
One of the threads we've been pursuing as part of the Fedora Futures project is integration with asynchronous and/or very slow storage. We've taken on AWS Glacier as a prime, generally accessable example. Uploading content is slow, but can be done synchronously in one API request:POST /:account_id/vaults/:vault_id/archives
x-amz-archive-description: Description
...Request body (aka your content)...POST /:account_id/vaults/:vault_id/jobs HTTP/1.1
{
"Type": "archive-retrieval",
"ArchiveId": String,
[...]
}Most Amazon Glacier jobs take about four hours to complete. You must wait until the job output is ready for you to download. If you have either set a notification configuration on the vault identifying an Amazon Simple Notification Service (Amazon SNS) topic or specified an Amazon SNS topic when you initiated a job, Amazon Glacier sends a message to that topic after it completes the job. [emphasis added]
Icemelt
If you're iterating on some code, waiting hours to get your content back isn't realistic. So, we wrote a quick Sinatra app called Icemelt in order to mock the Glacier REST API (and, perhaps taking less time to code than retrieving content from Glacier ). We've tested it using the Ruby Fog client, as well as the official AWS Java SDK, and it actually works! Your content gets stored locally, and the delay for retrieving content is configurable (default: 5 seconds). Configuring the official SDK looks something like this:PropertiesCredentials credentials = new PropertiesCredentials(
TestIcemeltGlacierMock.class
.getResourceAsStream("AwsCredentials.properties"));
AmazonGlacierClient client = new AmazonGlacierClient(credentials);
client.setEndpoint("http://localhost:3000/");Fog::AWS::Glacier.new :aws_access_key_id => '',
:aws_secret_access_key => '',
:scheme => 'http',
:host => 'localhost',
:port => '3000'